Global Opinion & Legal Context
Country-level acceptance, legal status, and authoritative regional reports (Pew, ILGA, UK Parliament briefing). Includes links to ready-made PDFs and maps.
This section synthesizes quantitative and qualitative evidence on LGBTQ+ Hindu experiences, offering concise summaries, recommended visualizations, and curated source links that support further analysis. Where appropriate, we foreground the human experiences that give these figures context while maintaining clear, reproducible references.
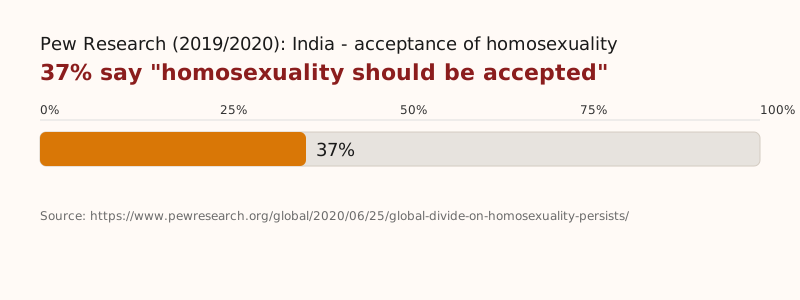
India (Pew, 2019): Approximately 37% of respondents said “homosexuality should be accepted,” showing notable gains versus prior waves. Source: Pew Research Center (Global Views on Homosexuality).
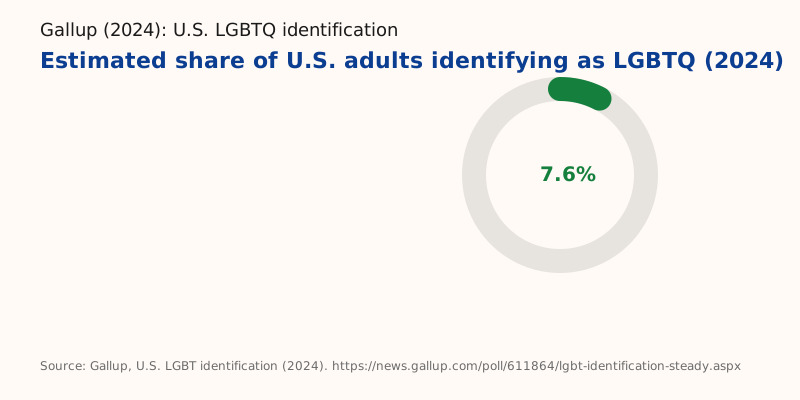
U.S. LGBTQ identification: Gallup reports an estimated 7.6% of U.S. adults identifying as LGBTQ in 2024 (headline estimate). Source: Gallup (2024).
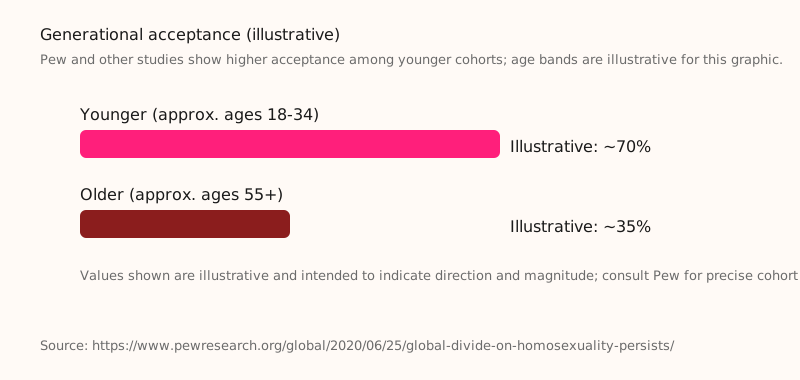
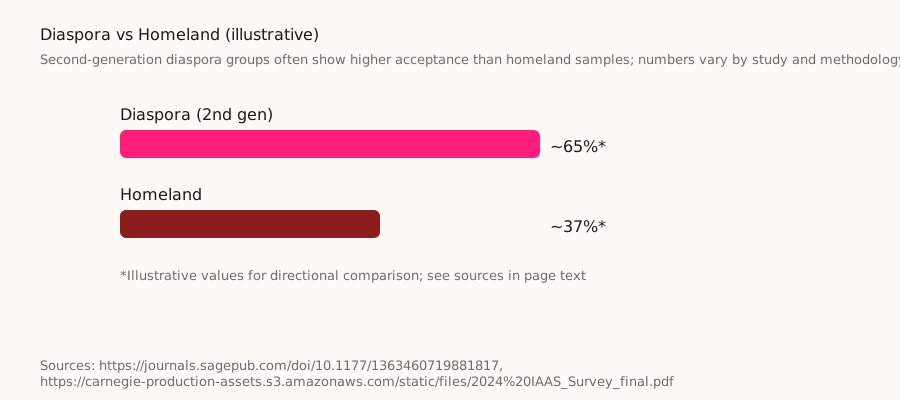
Pew and Williams Institute findings show younger cohorts are more accepting and more likely to identify as LGBTQ; second-generation South Asian diaspora populations often show higher acceptance than first-generation and homeland populations. Sources: Pew, Williams Institute, Carnegie Endowment IAAS 2024 (PDF).
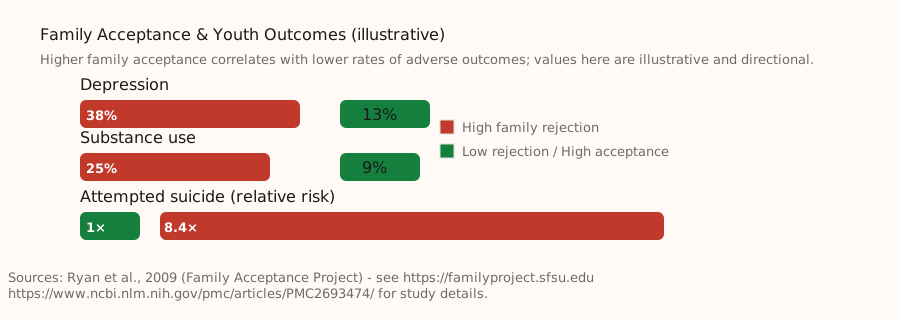
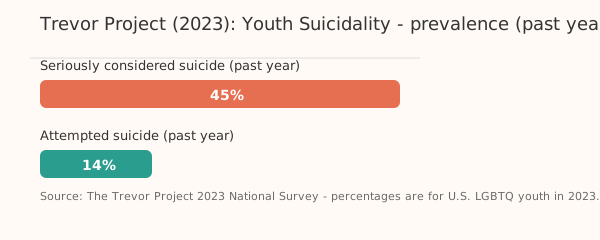
Research (Family Acceptance Project, Ryan et al., Trevor Project) links family acceptance to significantly lower depression, substance use, and suicide risk among LGBTQ youth. Sources include Family Acceptance Project and The Trevor Project (2023).
Add the following visualizations (images or SVGs) to illustrate the points above. Suggested filenames are shown for convenience.
Specific insights into LGBTQ+ Hindu communities, drawing from Pew Research, Williams Institute, and academic studies on South Asian diaspora experiences.
48% of LGBTQ+ U.S. adults identify with a religion (vs. 73% of non-LGBTQ+). Hindus are among the most highly educated religious groups. 52% of LGBTQ+ Americans are religiously unaffiliated.
698,000 LGBT adults received conversion therapy in their lifetime. 16,000 LGBT youth (13-17) will receive it annually in non-ban states. Strongly associated with poor mental health.
32% of LGBTQ+ adults have not come out to extended family. 23% not out to parents/guardians. Higher rejection rates in South Asian communities linked to worse mental health outcomes.


Country-level acceptance, legal status, and authoritative regional reports (Pew, ILGA, UK Parliament briefing). Includes links to ready-made PDFs and maps.
Generational acceptance trends, diaspora vs homeland comparisons, and the Carnegie IAAS 2024 data for Indian Americans (PDF).
Evidence summary linking family acceptance to measurable mental health outcomes and suggested visualization files for the Family Acceptance Project and Trevor Project findings.
Pew and Gallup are nationally representative for opinion and identity estimates; other sources (Williams Institute, ILGA, academic research, community surveys) provide complementary insights. Cross-country or diaspora-homeland comparisons should note differing survey methodologies and possible reporting bias; present figures as estimates with appropriate caveats rather than exact counts.